
The Greater St. George real estate market continues to change, but the August numbers tell a more nuanced story than "sales are up" or "sales are down."
Buyers have far more homes to choose from than two years ago; homes are generally taking longer to sell, and sellers face more competition. At the same time, buyers are still purchasing homes, and year-to-date sales remain remarkably close to 2025.
In short, this is not an inactive market. It is more selective and price-sensitive.
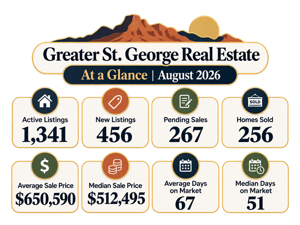
Greater St. George Housing Market at a Glance
The data covers residential properties in the Greater St. George MLS area.
 Inventory Is One of the Biggest Changes
Greater St. George ended August with 1,341 active homes for sale.
That number is down slightly from 1,353 in July, but the more important comparison is where inventory stood previously:
- August 2026: 1,341 active listings
- August 2025: 1,260 active listings
- August 2024: 995 active listings
Inventory is therefore about 6% higher than it was one year ago and nearly 35% higher than it was two years ago.
For buyers, that means more choices. Instead of feeling pressured to decide immediately because there may be nothing else available, buyers can often compare several properties.
For sellers, it means the opposite: more competition for each buyer.
If August's pace of 256 closed sales continued, active listings would represent roughly 5.2 months of inventory. That is a much more balanced environment than the exceptionally tight market we experienced in earlier years.
More Homes Came on the Market in August
August also brought a noticeable increase in new listings.
There were 456 new listings, compared with only 368 in July — an increase of almost 24% in one month.
That number was also slightly higher than August 2025, when 437 new listings entered the market.
This matters because today's sellers are competing not only against listings that have already been on the market. They are also competing against a continuing supply of newly listed homes.
Are Buyers Still Buying?
Yes — but they can afford to be more selective.
Pending sales actually improved in August. 267 homes went pending, up from 242 in July, an increase of approximately 10%.
Closed sales moved in the other direction. 256 homes sold in August, compared with 280 in July and 292 in August 2025. That puts August closings about 9% below July and 12% below last August.
But looking at one month alone can be misleading.
From January through August:
- 2026: 2,336 homes sold
- 2025: 2,352 homes sold
That is a difference of only 16 homes, or less than 1%.
That may be one of the most useful statistics in the current market. Despite substantially more inventory, the number of homes actually selling this year is almost identical to last year.
Buyers have not disappeared. They simply have more options.
What Are St. George Home Prices Doing?
August's sale price was $650,590, while the median sale price was $512,495.
For comparison, in August 2025:
- Average sale price: $672,942
- Median sale price: $530,000
Both August 2026 measures were approximately 3% below the same month last year.
However, monthly averages can move considerably depending on the mix of homes that happen to close. A month with more luxury sales can pull the average upward, while a larger number of lower-priced sales can move it down.
That is one reason I generally pay close attention to the median price, which represents the midpoint of the homes sold.
August's median price of $512,495 means half of the homes sold for more and half sold for less.
There Is a Noticeable Gap Between Listing Prices and What Is Selling
Another interesting number is the price of the inventory currently available.
The median active list price was $604,950 in August, compared with a median sale price of $512,495 for the homes that actually closed.
Those figures should not be treated as a direct list-to-sale-price comparison because they represent two different groups of homes. The active inventory may include a different mix of property types, neighborhoods, and price ranges.
Still, the gap is worth watching.
It reinforces something sellers are experiencing firsthand: the market is increasingly sensitive to price.
A home can be beautiful and well-maintained, but if buyers believe comparable alternatives offer better value, they now have enough inventory to move on to another property.
Homes Are Taking Longer to Sell
Days on market may be one of the clearest indications of how much the market has changed.
In August 2026:
- Average Days on Market: 67 days
- Median Days on Market: 51 days
The median was only 36 days in July.
Go back two years to August 2024, and the median was just 30 days.
That does not mean every home will take 51 or 67 days to sell. Attractive homes that are positioned correctly can still sell quickly.
But the overall trend shows that buyers are taking more time, and listings that miss the market on price can accumulate days on market while additional competition arrives.
What Does This Market Mean for Buyers?
For buyers, today's market offers something that was scarce several years ago: breathing room.
More inventory can mean:
- More homes to compare
- Less pressure to make an immediate offer
- Greater opportunity to negotiate
- Potential flexibility on repairs, closing costs, or other terms
That does not mean every seller will negotiate or that every desirable home will sit. A well-priced home in a sought-after neighborhood can still attract attention quickly.
But overall, buyers have more leverage than they did when inventory was extremely limited.
What Does This Market Mean for Sellers?
Sellers should not mistake slower market conditions for a lack of buyers.
Remember, the number of homes sold through August is almost identical to last year.
The challenge is that those buyers now have more homes competing for their attention.
That makes three things especially important:
Price. Condition. Presentation.
Pricing too high to "test the market" can be riskier when hundreds of competing properties are available. While a seller waits for buyers to come around, newer listings keep entering the market.
The strongest strategy is usually to understand what buyers are actually purchasing — not simply what other sellers are asking.
Is Greater St. George a Buyer'sBuyer's?
I would describe the current market as more balanced and more buyer-friendly, rather than simply labeling it a buyer's market.
Inventory has increased substantially, homes are taking longer to sell, and buyers have more room to negotiate.
But the market is still moving.
More than 2,300 homes sold through the first eight months of this year, almost exactly matching last year's
That is important context.
The Bottom Line
The August numbers show a Greater St. George housing market that is slower, more competitive, and more selective — but still active.
Buyers have considerably more inventory than they did two years ago. Sellers are waiting longer for offers, and pricing has become increasingly important. Yet year-to-date sales remain almost unchanged from 2025.
For buyers, that can create opportunities.
For sellers, it means understanding your competition and positioning your property correctly from the beginning matters more than ever.
As we move through the remainder of 2026, I will be watching inventory, pending sales, days on market, and actual sold prices closely. Those numbers should give us the clearest indication of whether Greater St. George continues moving toward buyers or begins to tighten again.
Market statistics are based on Greater St. George residential FlexMLS data through August 2026. Real estate conditions can vary significantly by neighborhood, community, property type, and price range.
What Do Current Market Conditions Mean for You?
Market statistics affect buyers and sellers differently. Explore current homes, learn more about my representation services, or contact me to discuss how these conditions may apply to your plans.




:format(webp):quality(80)/u.realgeeks.media/stgeorgeutrealestate/Sellers_button_circle.png)